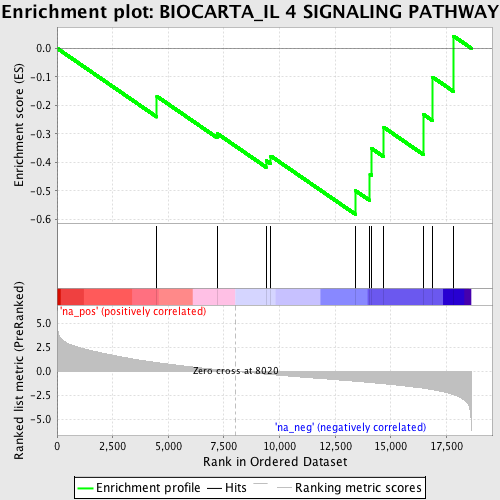
Profile of the Running ES Score & Positions of GeneSet Members on the Rank Ordered List
| Dataset | set03_wtNotch_versus_truncNotch |
| Phenotype | NoPhenotypeAvailable |
| Upregulated in class | na_neg |
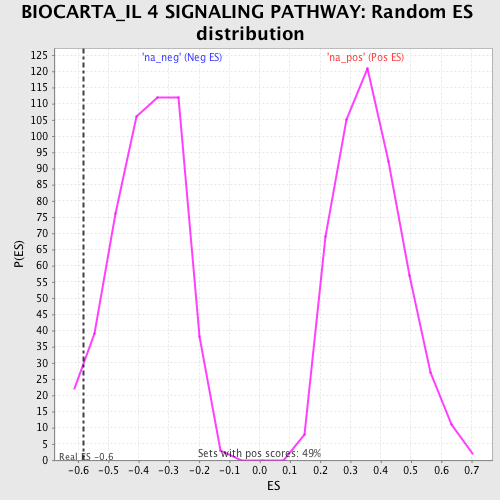
| GeneSet | BIOCARTA_IL 4 SIGNALING PATHWAY |
| Enrichment Score (ES) | -0.5828561 |
| Normalized Enrichment Score (NES) | -1.5607191 |
| Nominal p-value | 0.04330709 |
| FDR q-value | 0.44897935 |
| FWER p-Value | 1.0 |
| PROBE | GENE SYMBOL | GENE_TITLE | RANK IN GENE LIST | RANK METRIC SCORE | RUNNING ES | CORE ENRICHMENT | |
|---|---|---|---|---|---|---|---|
| 1 | GRB2 | 4485 | 0.912 | -0.1685 | No | ||
| 2 | AKT1 | 7193 | 0.191 | -0.2988 | No | ||
| 3 | IL2RG | 9394 | -0.294 | -0.3936 | No | ||
| 4 | JAK1 | 9606 | -0.341 | -0.3778 | No | ||
| 5 | IL4R | 13422 | -1.042 | -0.4999 | Yes | ||
| 6 | IL4 | 14062 | -1.165 | -0.4416 | Yes | ||
| 7 | SHC1 | 14136 | -1.182 | -0.3514 | Yes | ||
| 8 | JAK3 | 14685 | -1.301 | -0.2773 | Yes | ||
| 9 | RPS6KB1 | 16473 | -1.770 | -0.2326 | Yes | ||
| 10 | HMGA1 | 16874 | -1.926 | -0.1008 | Yes | ||
| 11 | STAT6 | 17823 | -2.443 | 0.0426 | Yes |